
Every published Flow comes with a built-in statistics panel that shows you exactly how contacts move through your automation — from the first trigger all the way to a resolution, escalation, or drop-off. No external tools needed.
Accessing Flow stats
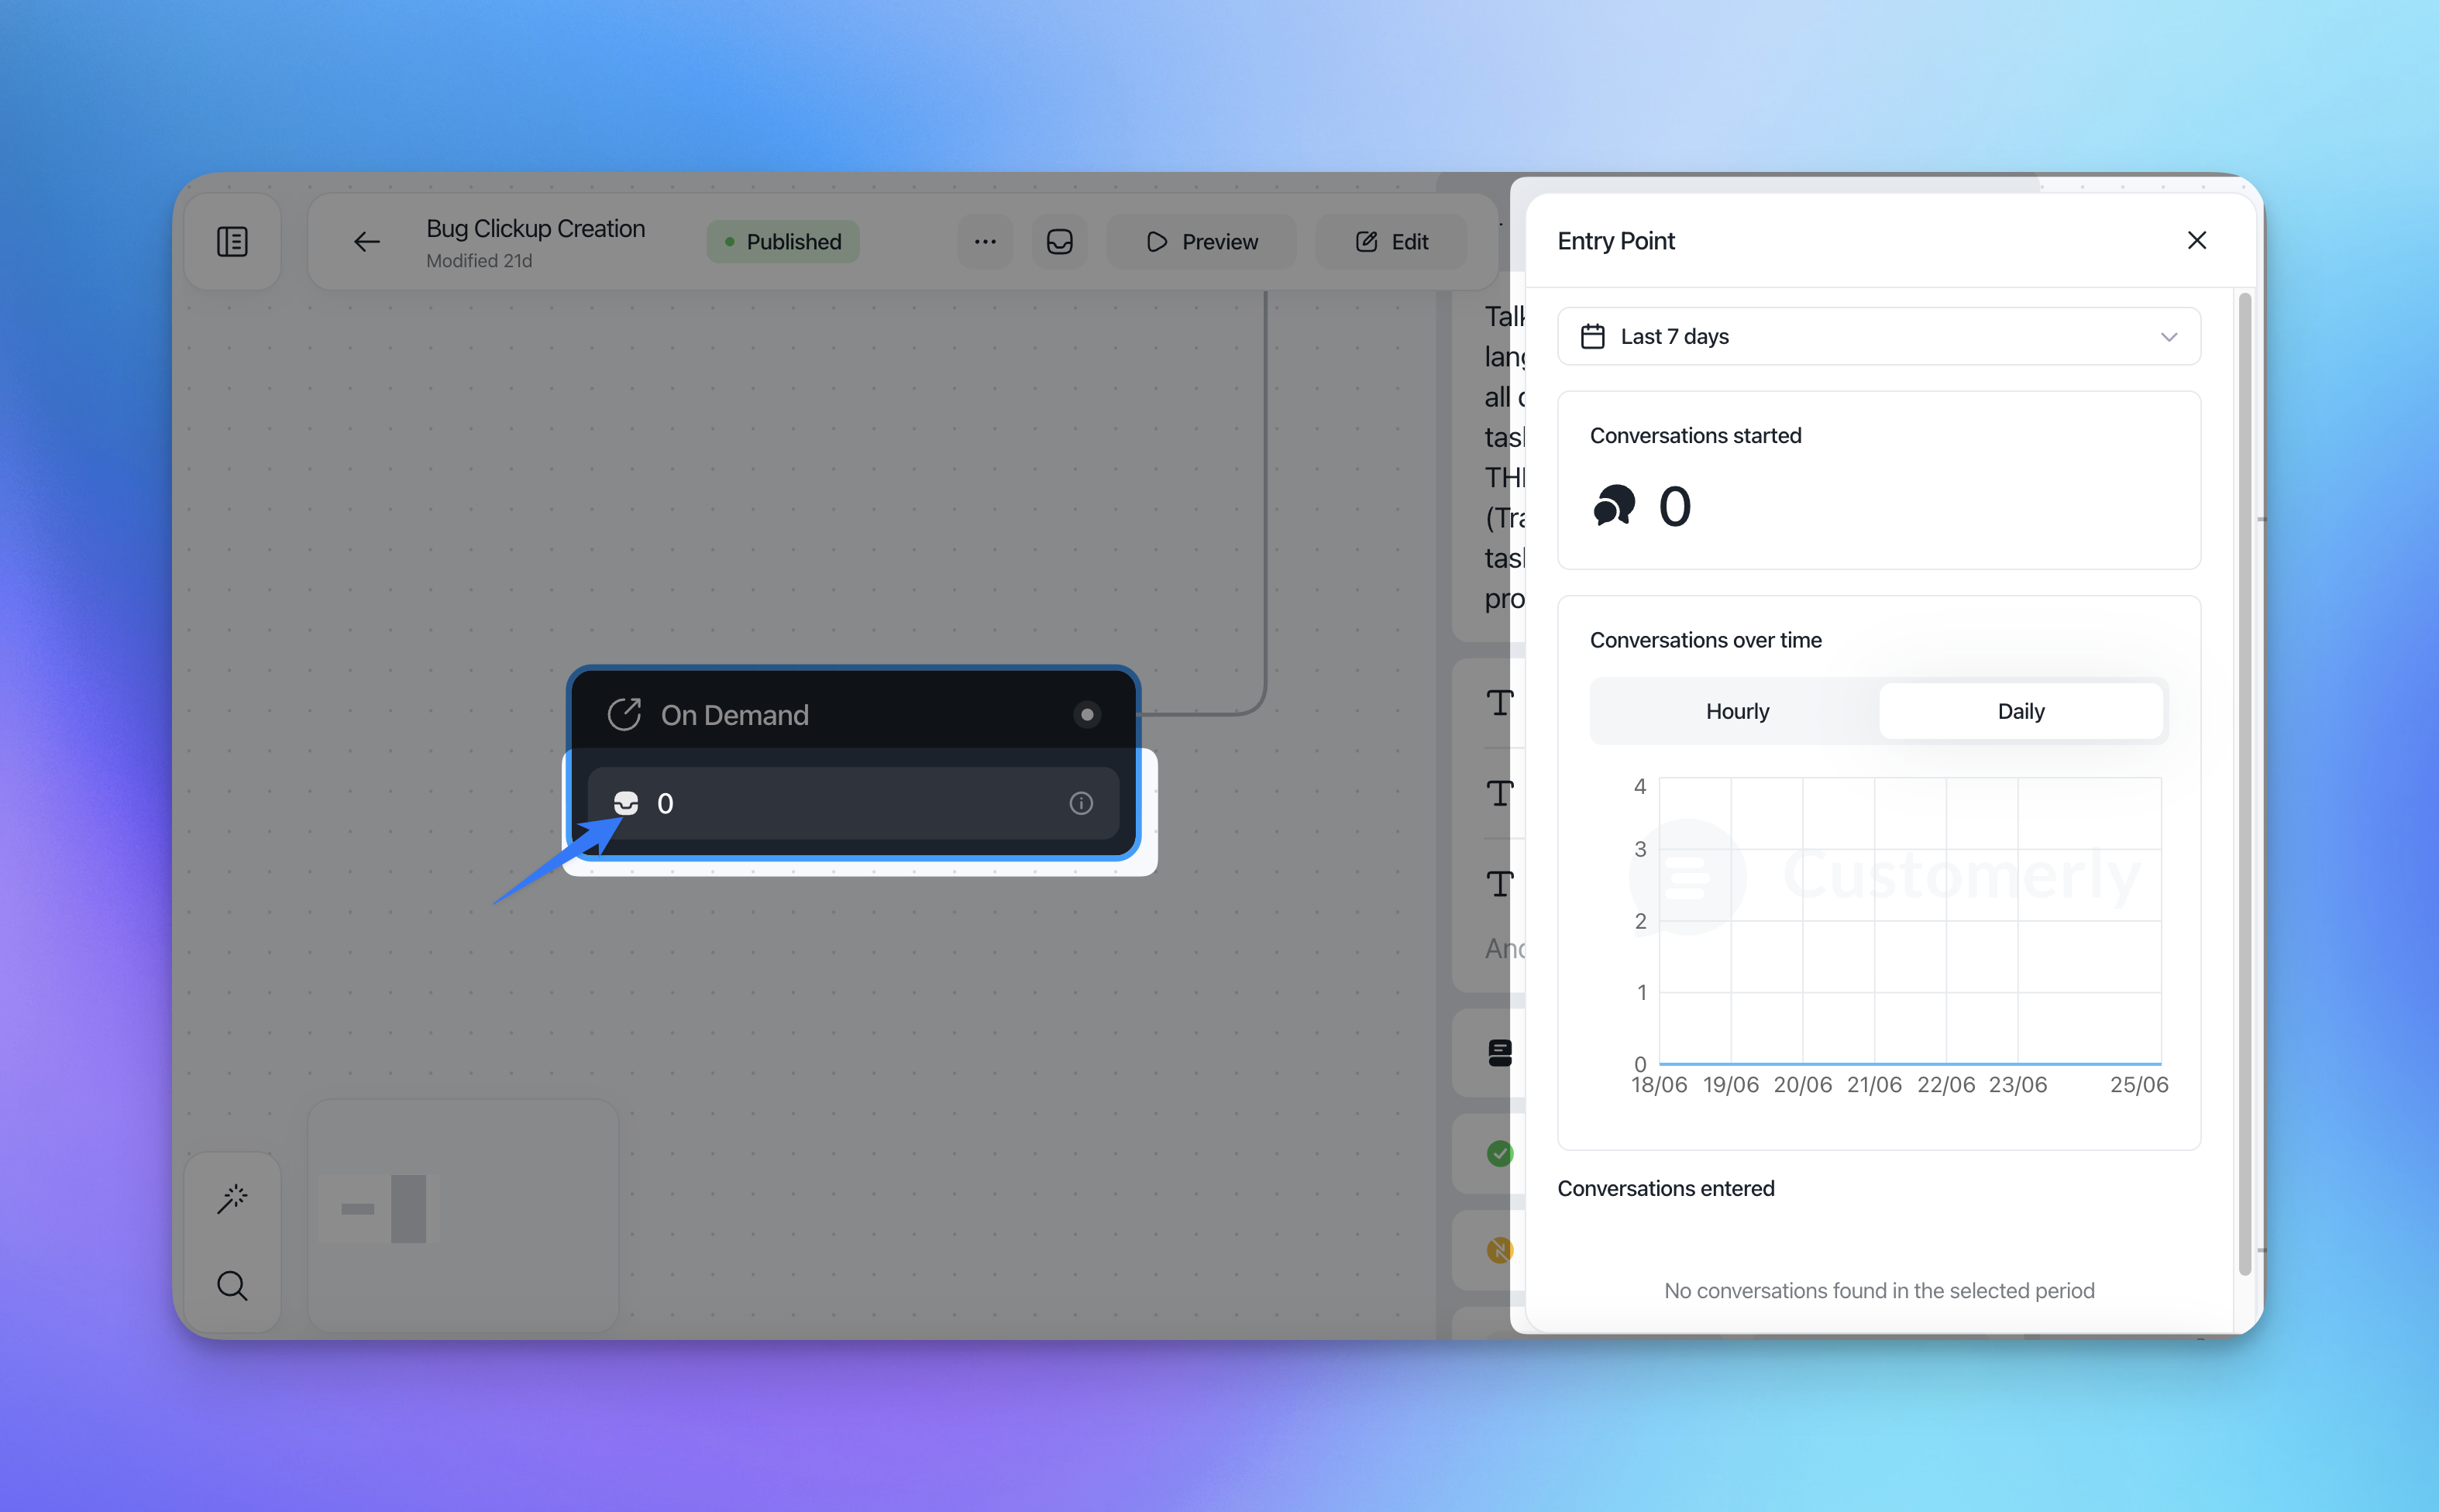
Open any Flow in the editor and click on any node to check the stats
Global filters
All stats across the panel share the same filters:
Filter | Options |
|---|---|
Date range | Last 7 days (default), Last 30 days, Last 90 days, Custom range |
Granularity | Hourly or Daily (for all time-series charts) |
A few things to keep in mind:
Stats data is collected from 1 June 2026 onwards. Earlier conversations are not included.
Headline numbers update in real time. Charts and historical breakdowns are updated nightly.
If a node has been live for less than an hour, stats show "No data yet" rather than zero.
Bot activity and messages from team members on the same domain are excluded from all counts.
When you publish a new version of a Flow, stats are isolated per version. Each version tracks its own data independently.
Flow-level stats
These numbers reflect the performance of the entire Flow, not a single node.
Metric | What it measures |
|---|---|
Triggered | How many times the Flow's entry conditions were matched |
Shown | How many times the Flow's popup or banner was actually rendered to a contact |
Conversations started | Conversations initiated directly from this Flow |
Replies received | Replies from contacts to Flow-initiated messages |
Form submissions | Total form completions across all Collect Data nodes in the Flow |
Leads created | New contacts identified and created through this Flow |
Leads enriched | Existing contacts whose data was updated by this Flow |
Conversations fully handled by Flow | Conversations that reached an end node with no human or Aura involvement |
Conversations escalated to human | Conversations handed off to a human agent |
Conversations escalated to Aura | Conversations handed off to Aura AI |
Avg time to completion | Average time from Flow trigger to reaching an end node |
Avg time to escalation | Average time from Flow trigger to escalation |
CSAT | Average score + number of responses (only shown when a CSAT node is present) |
Drop-off rate | % of contacts who abandoned the Flow before reaching an end node |
Node-level stats
Click any node in the Flow editor to see its individual statistics.
Send a Message / Send a Choice
Metric | Description |
|---|---|
Messages sent | Total impressions of this node |
Selection rate | % of contacts who made a choice |
Drop-off rate | % who left without selecting |
Per-option breakdown | Count and % for each option (e.g. "Level 1: 88.4% · 197 contacts") |
Avg time to selection | How long contacts take to choose |
Send a Notification
The Notification node supports four display variants (Full screen, Popup, Small popup, Banner) and optional additions (CTA button, Meeting Scheduler, Start Conversation button, Input Field, Image, Video, Article). Stats adapt to whichever additions are configured on the node.
Delivery & visibility
Metric | Description |
|---|---|
Notifications displayed | Total impressions |
Unique users reached | Deduplicated contacts who saw the notification |
Time on screen | Median time before close or click |
Closed / dismissed | Count + %, including rage-closes (closed within 2 seconds, flagged separately) |
Auto-dismissed | Timed out without interaction — count + % |
View-through rate | % who saw the notification long enough to count as viewed |
Engagement
Metric | Description |
|---|---|
Click-through | Count + % (any interactive element clicked) |
Conversations started | Count + % of impressions |
Leads generated | Count + % of impressions (also visible in the Leads tab) |
Per-addition breakdown
One row per addition configured on the node:
Addition | Stats shown |
|---|---|
Custom Button (CTA) | Clicks, CTR %, button label, destination URL |
Meeting Scheduler | Clicks, meetings booked, booking conversion % |
Start Conversation Button | Clicks, conversations opened, drop-off % after click |
Input Field | Submissions, completion rate, exportable sample of values |
Image | Clicks + CTR (if the image is clickable) |
Video | Plays, % who pressed play, avg watch %, completion rate |
Article | Opens, read-through % (links to Help Center stats) |
Campaign effectiveness
Conversion funnel — Displayed → Viewed → Clicked → Converted (lead / conversation / booking)
Effectiveness score — a single % calculated as primary CTA conversions ÷ impressions (you can configure which addition counts as "primary")
Trend chart — impressions, clicks, and conversions over time (hourly/daily toggle)
Heatmap — activity by hour of day and day of week, so you can see when the notification actually works
Per-page breakdown — top 10 pages by impressions and by CTR
Device split — Desktop / Mobile / Tablet
Collect Data
Metric | Description |
|---|---|
Requests sent | How many times this node was reached |
Completion rate | % of contacts who completed the form |
Data collected over time | Hourly/daily chart of submissions |
Per-field fill rate | % of contacts who filled each field |
Per-field drop-off | Which field causes the most abandonment |
Avg time to complete | Average time to fill the form |
Type of data collected | Bar chart showing count per field name |
Choose Company
Metric | Description |
|---|---|
Requests sent | How many times this node was reached |
Completion rate | % of contacts who selected a company |
Top companies selected | Top 10 selections with count |
Drop-off rate | % who left without selecting |
Set Property
Metric | Description |
|---|---|
Executed count | How many times this node ran |
Properties set over time | Hourly/daily trend |
Per-property breakdown | Which property was set + top 10 value distribution |
Condition
Metric | Description |
|---|---|
Evaluated count | How many times this node was evaluated |
Per-branch distribution | Count + % per outgoing branch (e.g. "Matched: 88.4% · Else: 11.6%") |
Nodes with more than two branches show one row per branch.
Assign To
Metric | Description |
|---|---|
Assigned chats | Total conversations assigned through this node |
Assignee / team | Who conversations were assigned to |
Avg time to first reply | After assignment, how long before the agent responded |
SLA compliance | % of assigned chats that received a human reply within SLA |
Reassignment rate | % bounced to another agent or team |
REST API
Metric | Description |
|---|---|
Requests sent | Total API calls made |
Completion rate | % of calls that succeeded |
Failure rate | % of calls that failed |
Response code distribution | Bar chart of 200 / 4xx / 5xx responses |
Error rate over time | Hourly/daily trend |
Avg response latency | p50 and p95 |
Last error sample | Timestamp + status code + truncated response body for debugging |
Launch a Flow
Metric | Description |
|---|---|
Launched count | How many times the target Flow was launched from here |
Target Flow | Name with direct link to that Flow |
Completion rate | % of contacts who completed the launched Flow (cross-flow link) |
Delete Contact
Metric | Description |
|---|---|
Executed count | How many contacts were deleted |
Trend over time | Hourly/daily chart |
Close Conversation / CSAT
Metric | Description |
|---|---|
Conversations closed | Closed by this node |
CSAT responded | Number of CSAT responses received |
CSAT score distribution | Links to Insights — not duplicated here |
Reopen rate | % of Flow-closed conversations reopened within 24h and within 7 days |
Conversations closed by a Flow are flagged with a "Handled by flow" attribution in the conversation record.